- Dashboard
- General reports
- Closed loop
- Weighted mean widget
- Push metrics
- Share dashboard link
- Sentiment and root cause analysis
- NPS Benchmark
- Priority Matrix
- Heatmap Widget
- NPS
- Designing CX Dashboard
- Sentiment Analysis Details
- Share Dashboard
- Enable Dashboard on Portal
- Custom Metrics
- Survey Resting Period
- Custom Metrics - Grid Widget
- CX Dashboard Sorting
Custom Metrics - Grid Widget
Custom Metrics allows you to capture a number according to the code written by you on the Custom Metrics screen, similarly, this widget allows you to display the count/average of the Metrics in a particular survey in a tabular format.
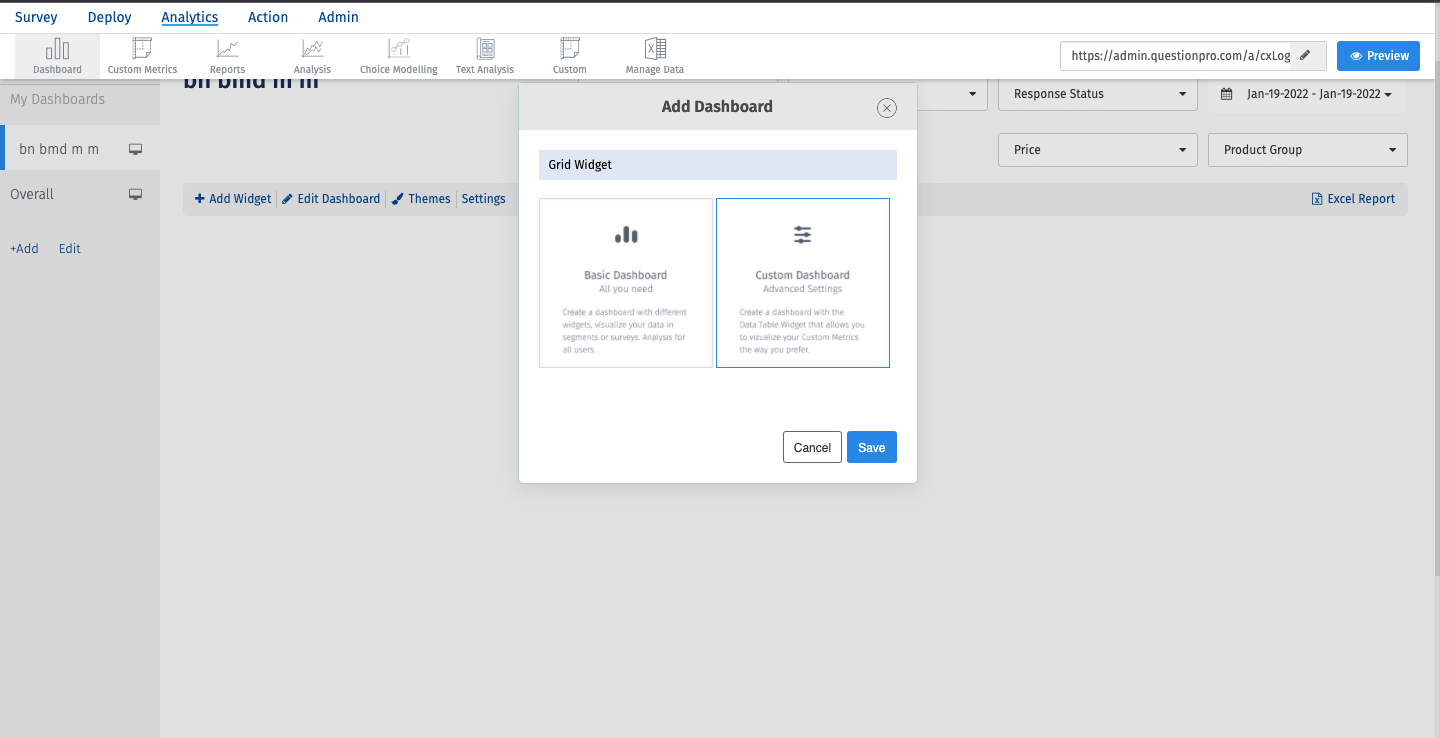
- Click on Analytics >> Dashboards >> Click on “Add” Button from the left side bar >> Provide the Dashboard Name >> Click on “Custom Dashboard” card
- Click on “+ Add Custom Grid” >> Select the survey of which you wish to see the results
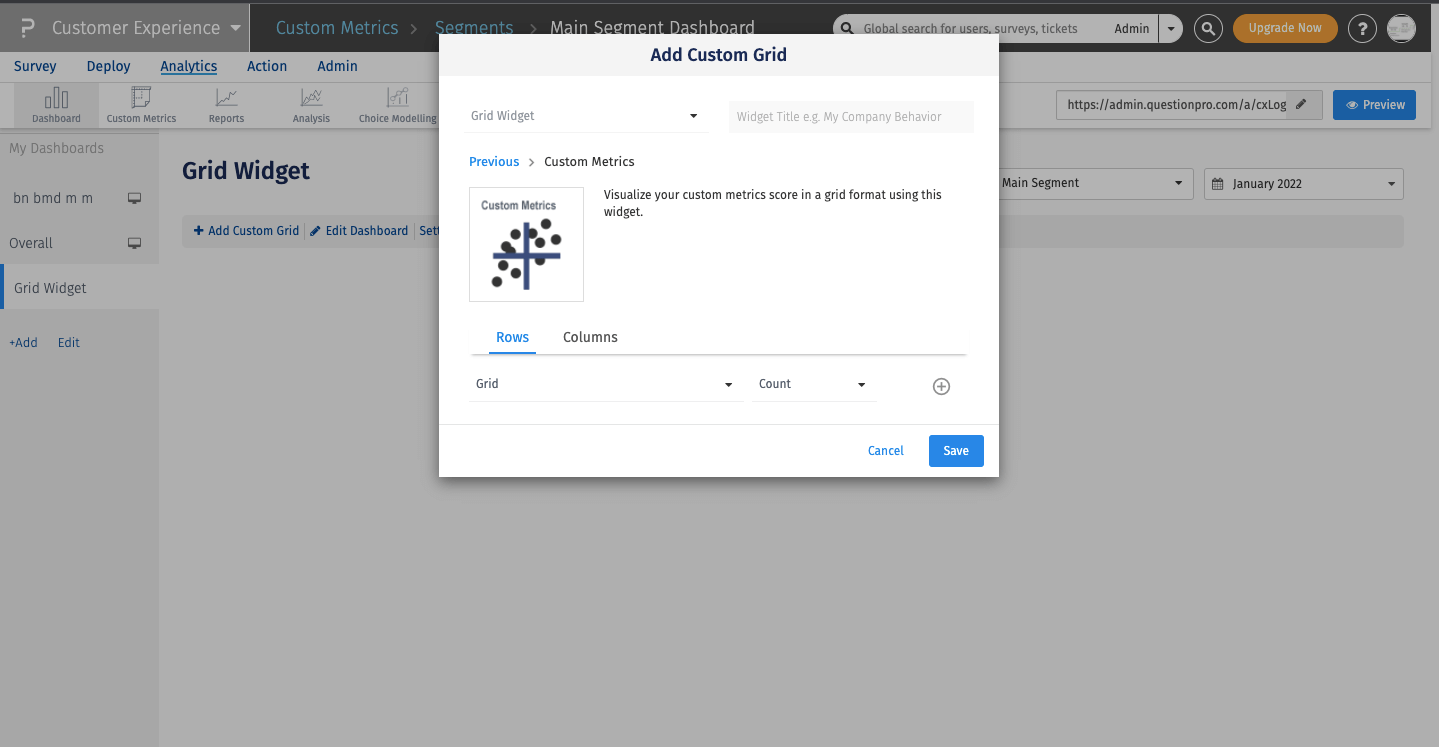
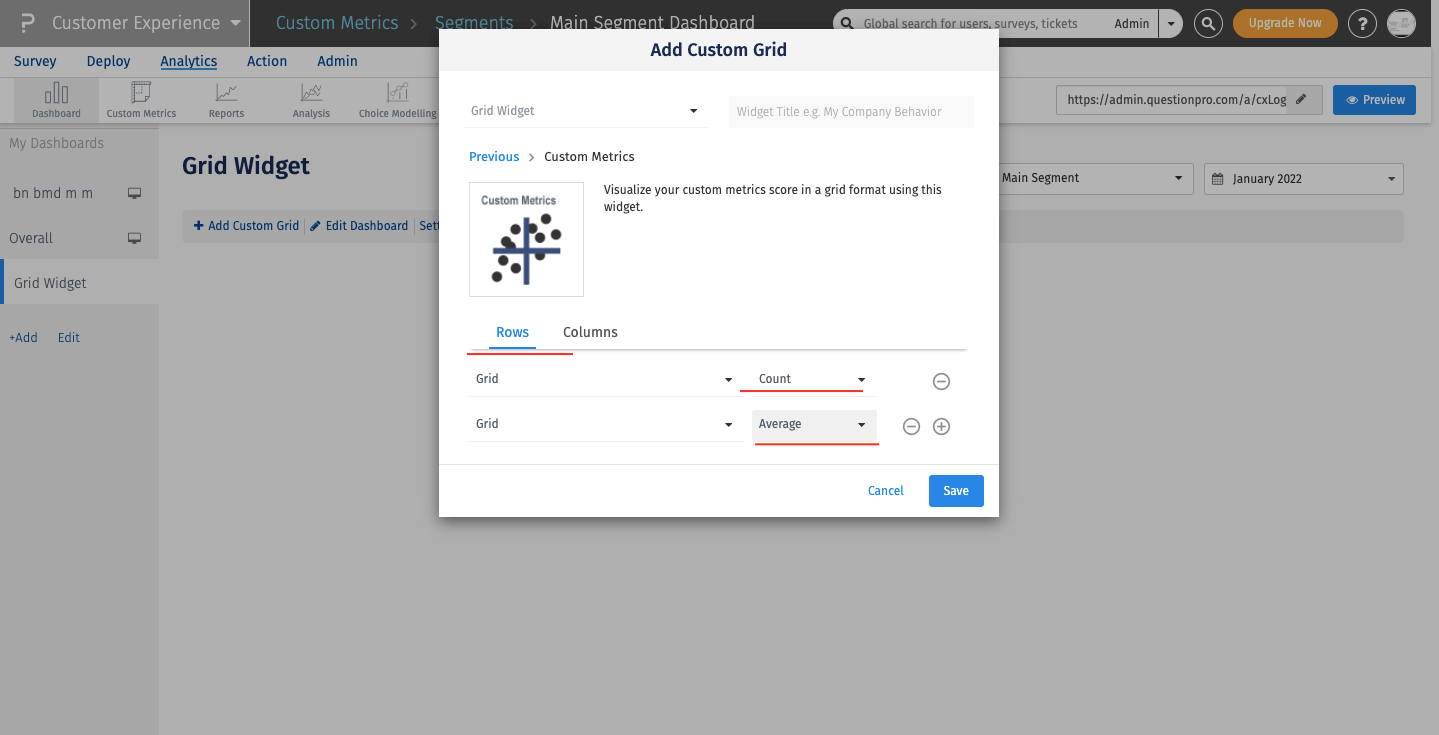
Under Rows,
- Firstly you will have to select the Custom Metrics of that survey for which you wish to populate the result
- Second is the option that allows you to select between the number of responses or the Average of the responses to be displayed.
- + button to add any other Custom Metrics for that survey and correspondingly average/count
Example: For my survey “Grid Widget” I have set up 3 Custom Metrics and I wish to display the Average of all 3 Custom Metrics. Hence, from the Rows part, I’ll select Survey 1, Average, then click on the “+” button, select Survey 2, Average, and so on.
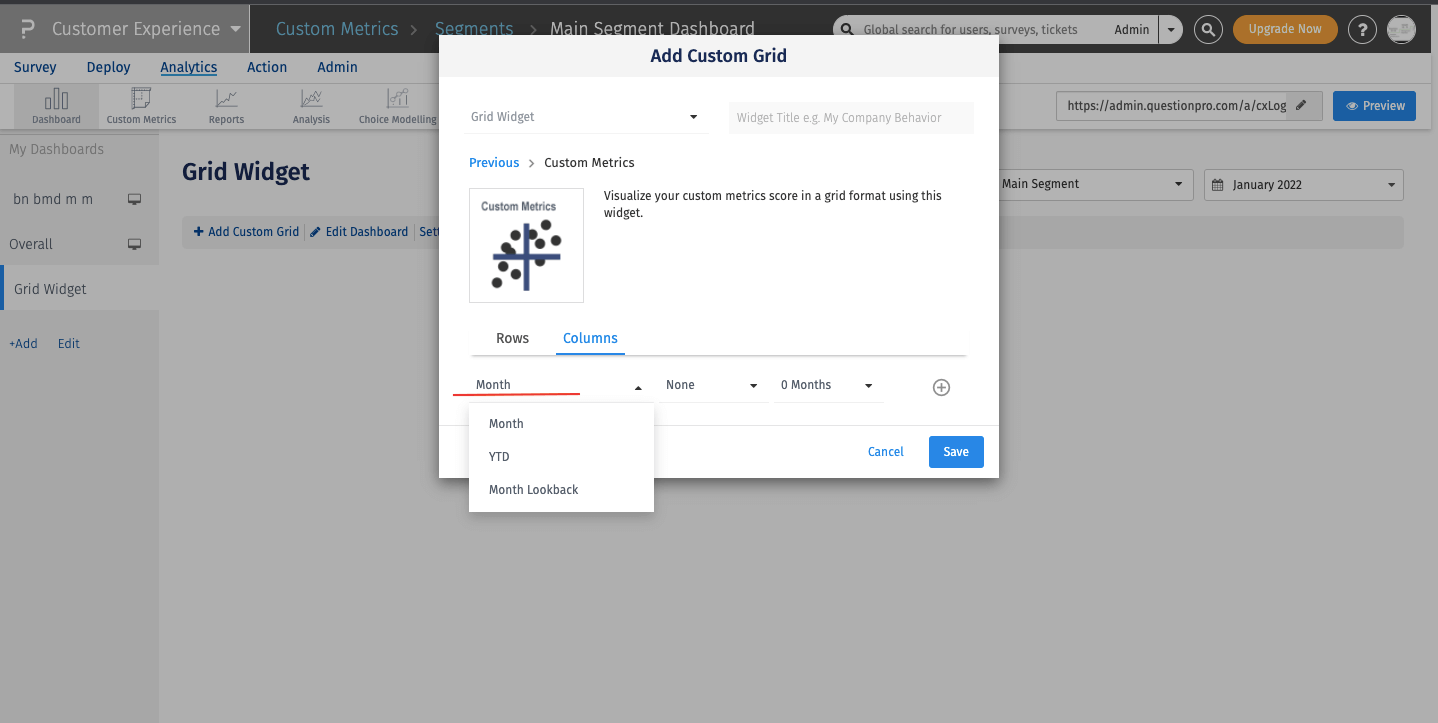
Under Column,
- Firstly, it’ll ask you to select from 3 options “Month, YTD (Year To Date) or Month Lookback”
- Secondly, it’ll ask to apply a filter “None, Global or Parent’
- Thirdly, it’ll ask to select the number of months based on the Filter selected in step 1/2.
- So the first column asks to select one option, either Month, YTD (Year To Date) or Month Lookback.
- If you select Month, the data displayed on the screen will be of the Anchor Month selected.
- Anchor month is the month that is set up on the dashboard
- If you select YTD, it will display the data starting from the date and the year selected of the anchor month till the current date.
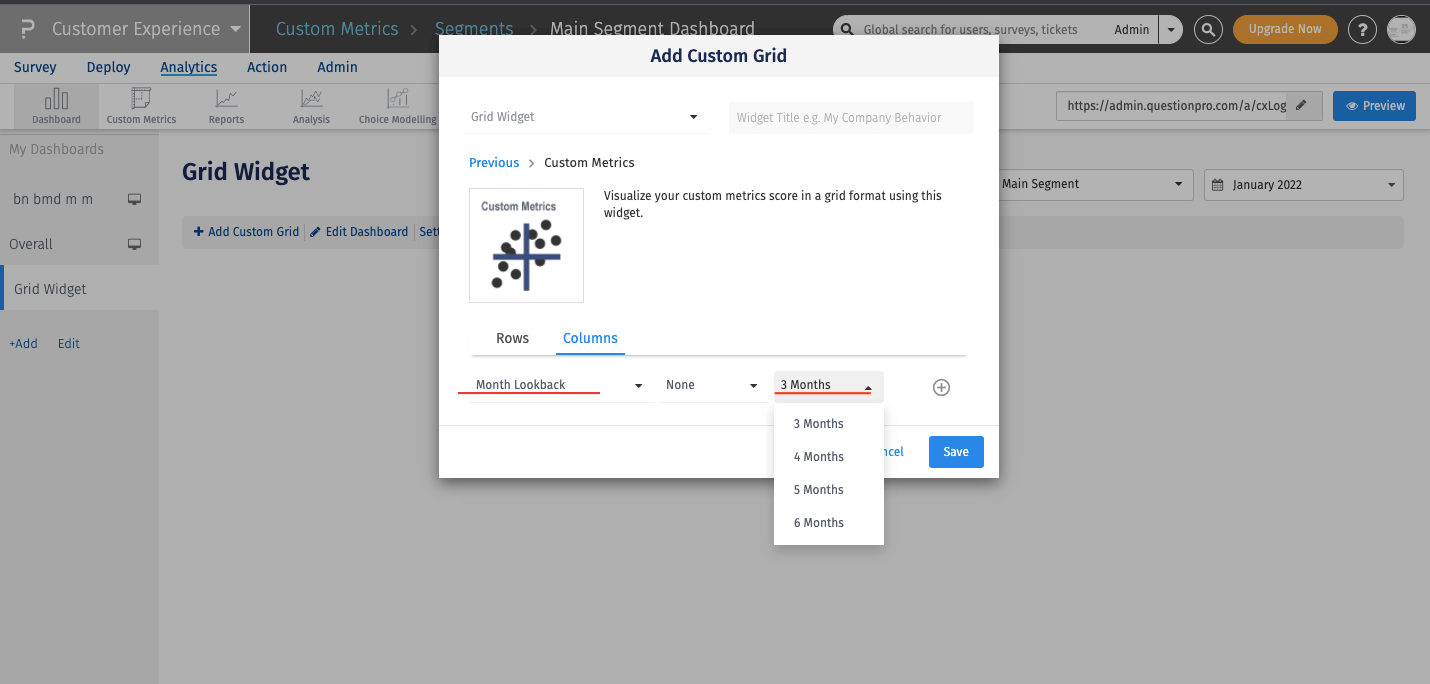
- If you select the Month Lookback, it will display the aggregate data of those many months. Let’s say you wish to see the aggregate data of 5 months.
- In the Month Lookback option, we only display the months from the range 3-6 months(both inclusive)

- The next column asks you to make a choice on the filter. Here we’ve 3 options: “None, Global or Parent”
- If you wish to see the data, without any filter, choose None
- If you wish to see the data of the Main Segment, you need to choose a Global filter. Here, if you are already viewing the Main Segment data and you choose a filter as Global, no changes will be there in the result. However, if you are viewing the data of a child segment, and in this case, you apply filters as Global, you will then see the data of the Main Segment.
- If you wish to see the data of the Parent, then use this filter. This will provide the data of the child segment and the Parent of that segment.
- The last filter is based on the selection made in the 1st/and (or) 2nd option.
- If selected is “Month” and filter selected is “None”, then you will need to fill in the number of months for which you would like to see the data.
- If selected “Month Lookback”, then you need to select a filter and then enter the number of months.
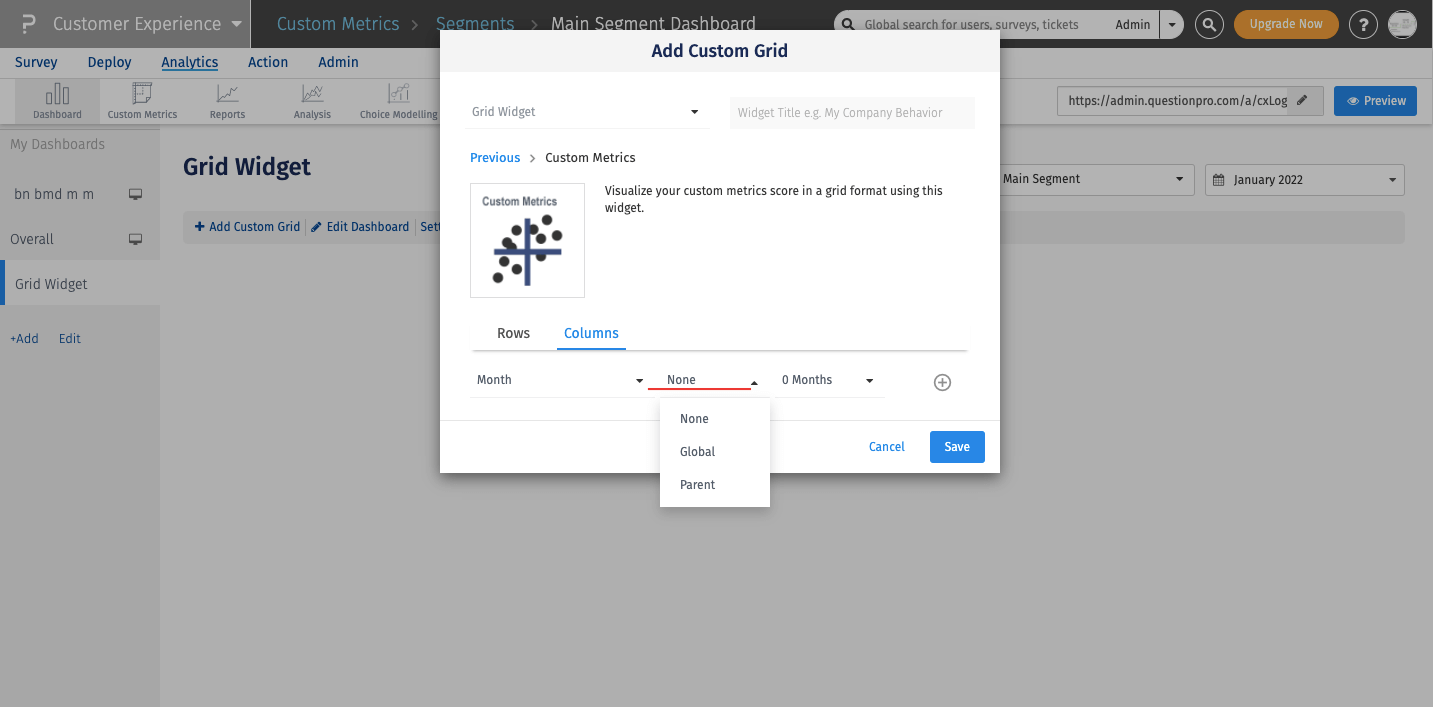
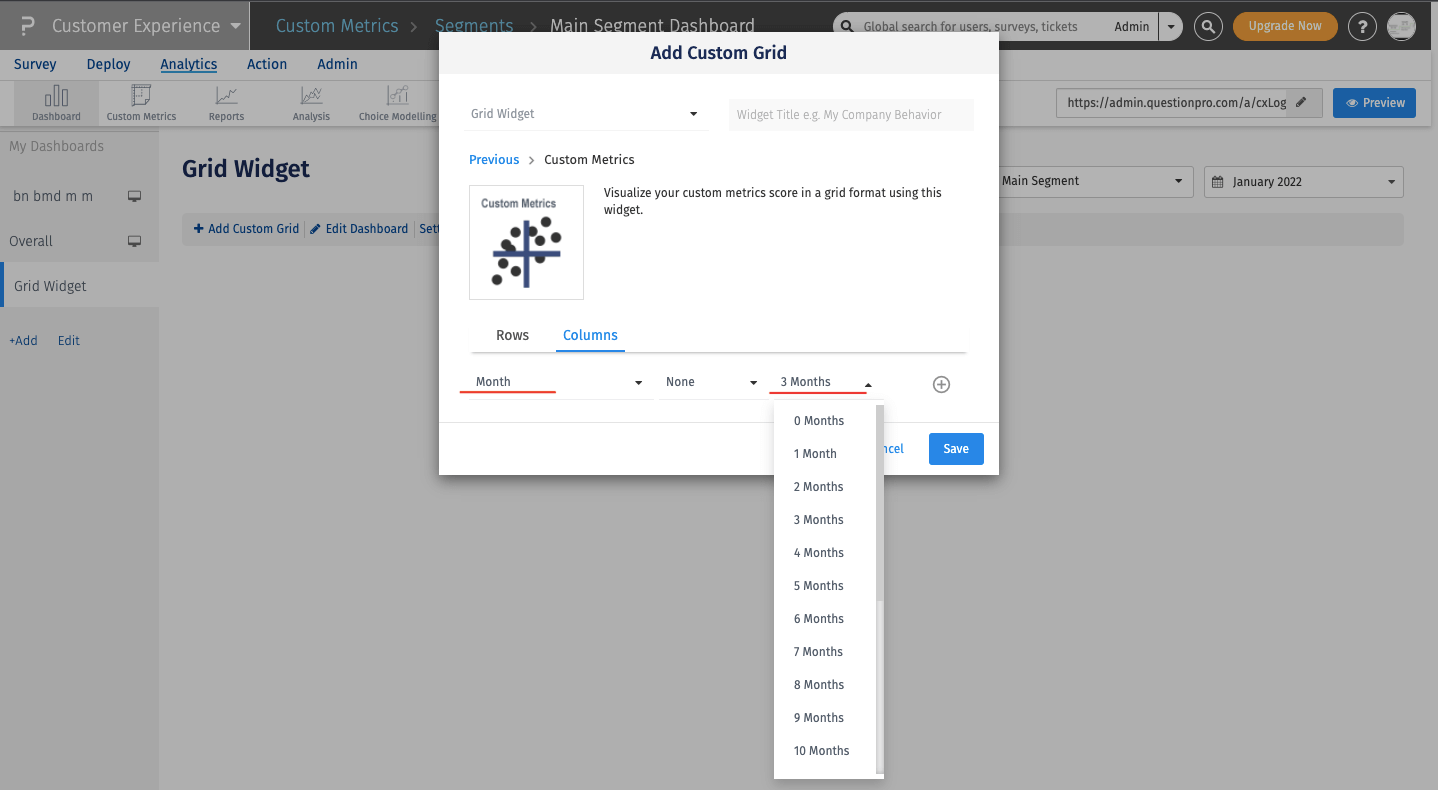
So, if you select Month >> None >> X Months, in this case, you will get the individual those many months data depending on the anchor month.
If you select the Month Lookback option, then it will provide the aggregate data from the Anchor month till the time frame selected by you.
Result = Data of Main Segment and all its segments under it
Result = Data for the Immediate Parent. i.e. Immediate parent and all segments under it.
Then the output displayed will be N/A as there is no Parent of the Main Segment.
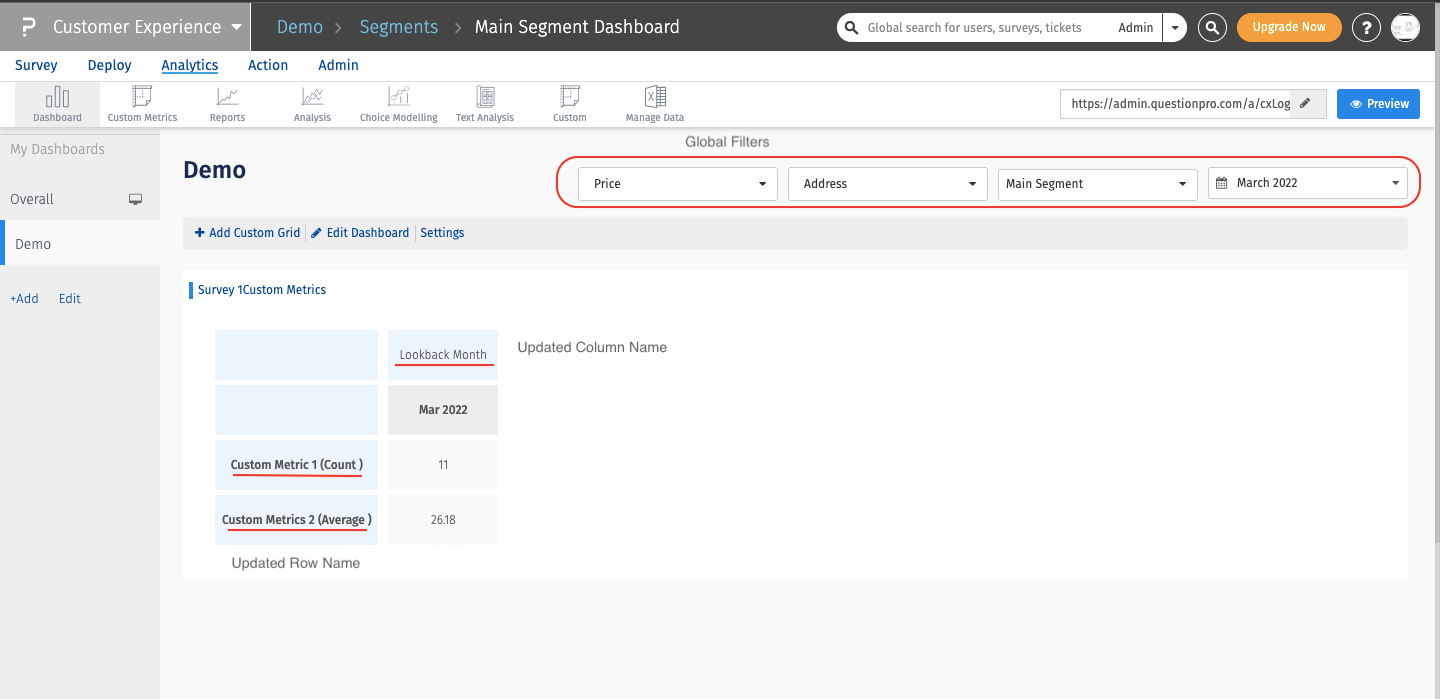
- You get the privilege of editing the name of the row or the column as per your wish.
- We are providing 3 Global filters to use:
- Filtering on the basis of Custom Variable used
- Filtering on the basis of Segments
- Filtering on the basis of Month and Year
- Once the widget is set up, after the row name, we have added a suffix as Count/Average, that informs whether the numbers in the grid are providing the count of responses or the average of them.
