- Dashboard
- General reports
- Closed loop
- Weighted mean widget
- Push metrics
- Share dashboard link
- Sentiment and root cause analysis
- NPS Benchmark
- Priority Matrix
- Heatmap Widget
- NPS
- Designing CX Dashboard
- Sentiment Analysis Details
- Share Dashboard
- Enable Dashboard on Portal
- Custom Metrics
- Survey Resting Period
- Custom Metrics - Grid Widget
- CX Dashboard Sorting
CX- Infographic Report
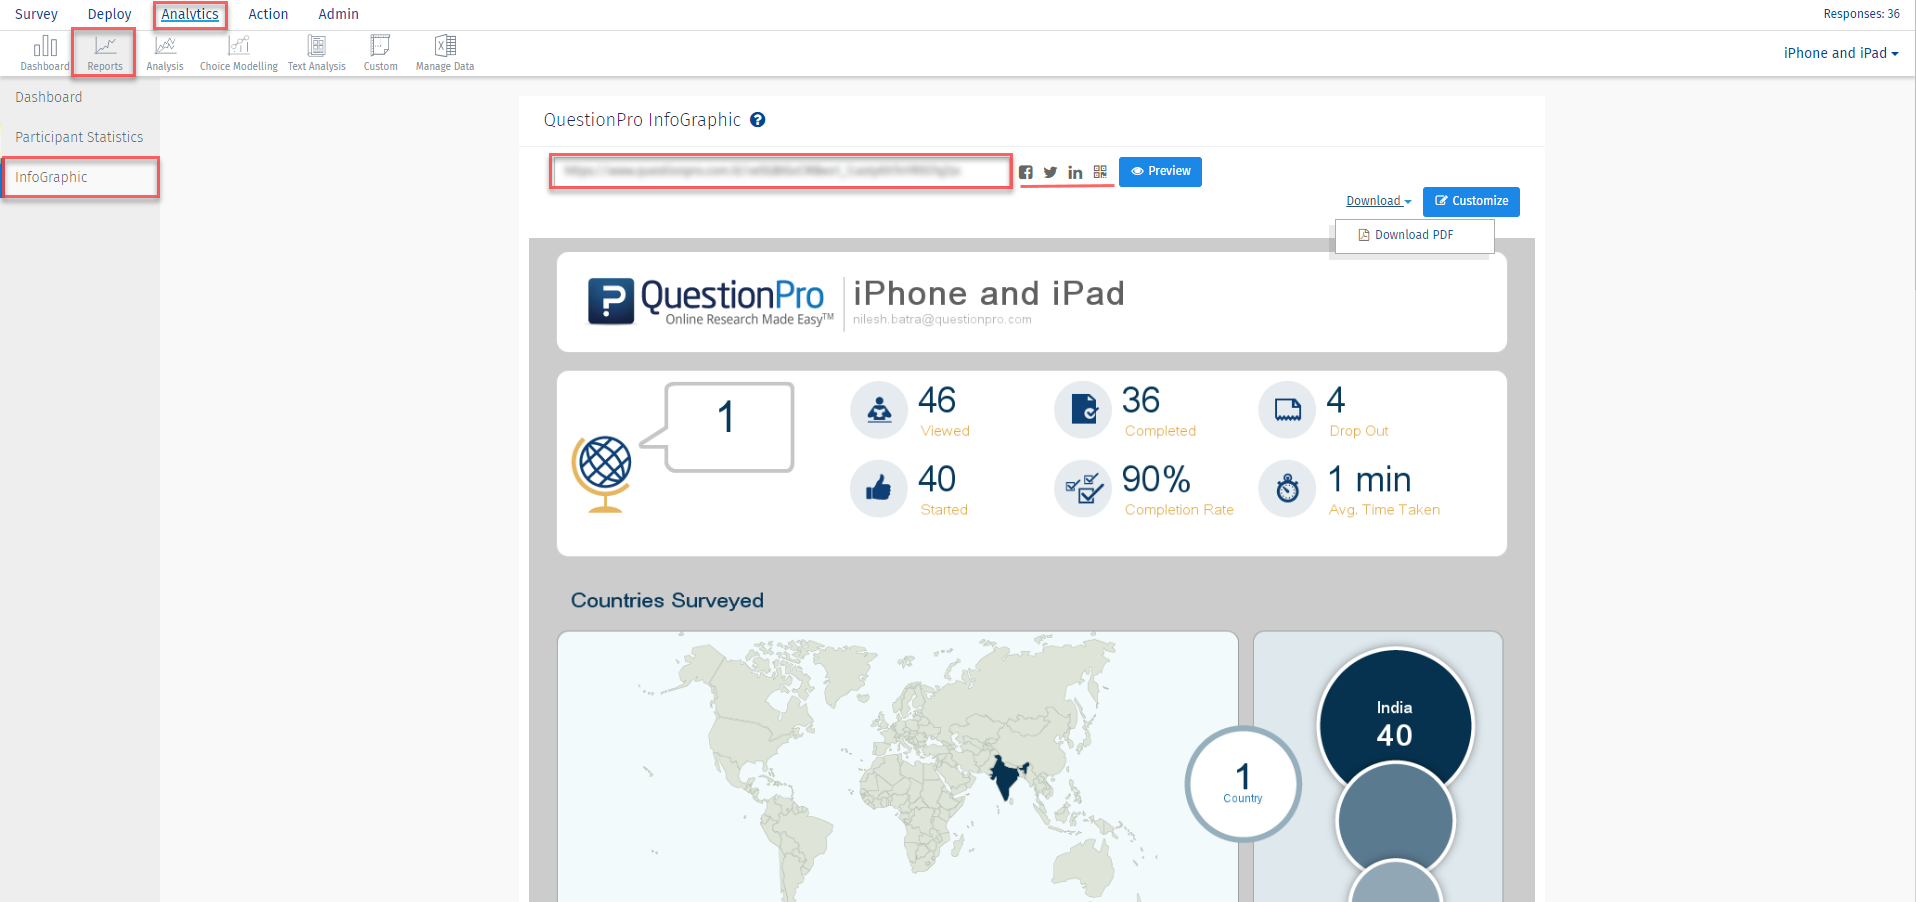
Infographics are graphic visual representations of information, data or knowledge intended to present information quickly and clearly. Our Infographic report comes with eye catching visualizations of your demographic data followed by the survey question charts.
To access the Infographic Report for your survey please follow the steps:
Login >> Customer Experience >> Analytics >> Reports >> InfoGraphic

You can share the Infographic Report, by sharing the link, or posting it on the social media or providing the QR code.

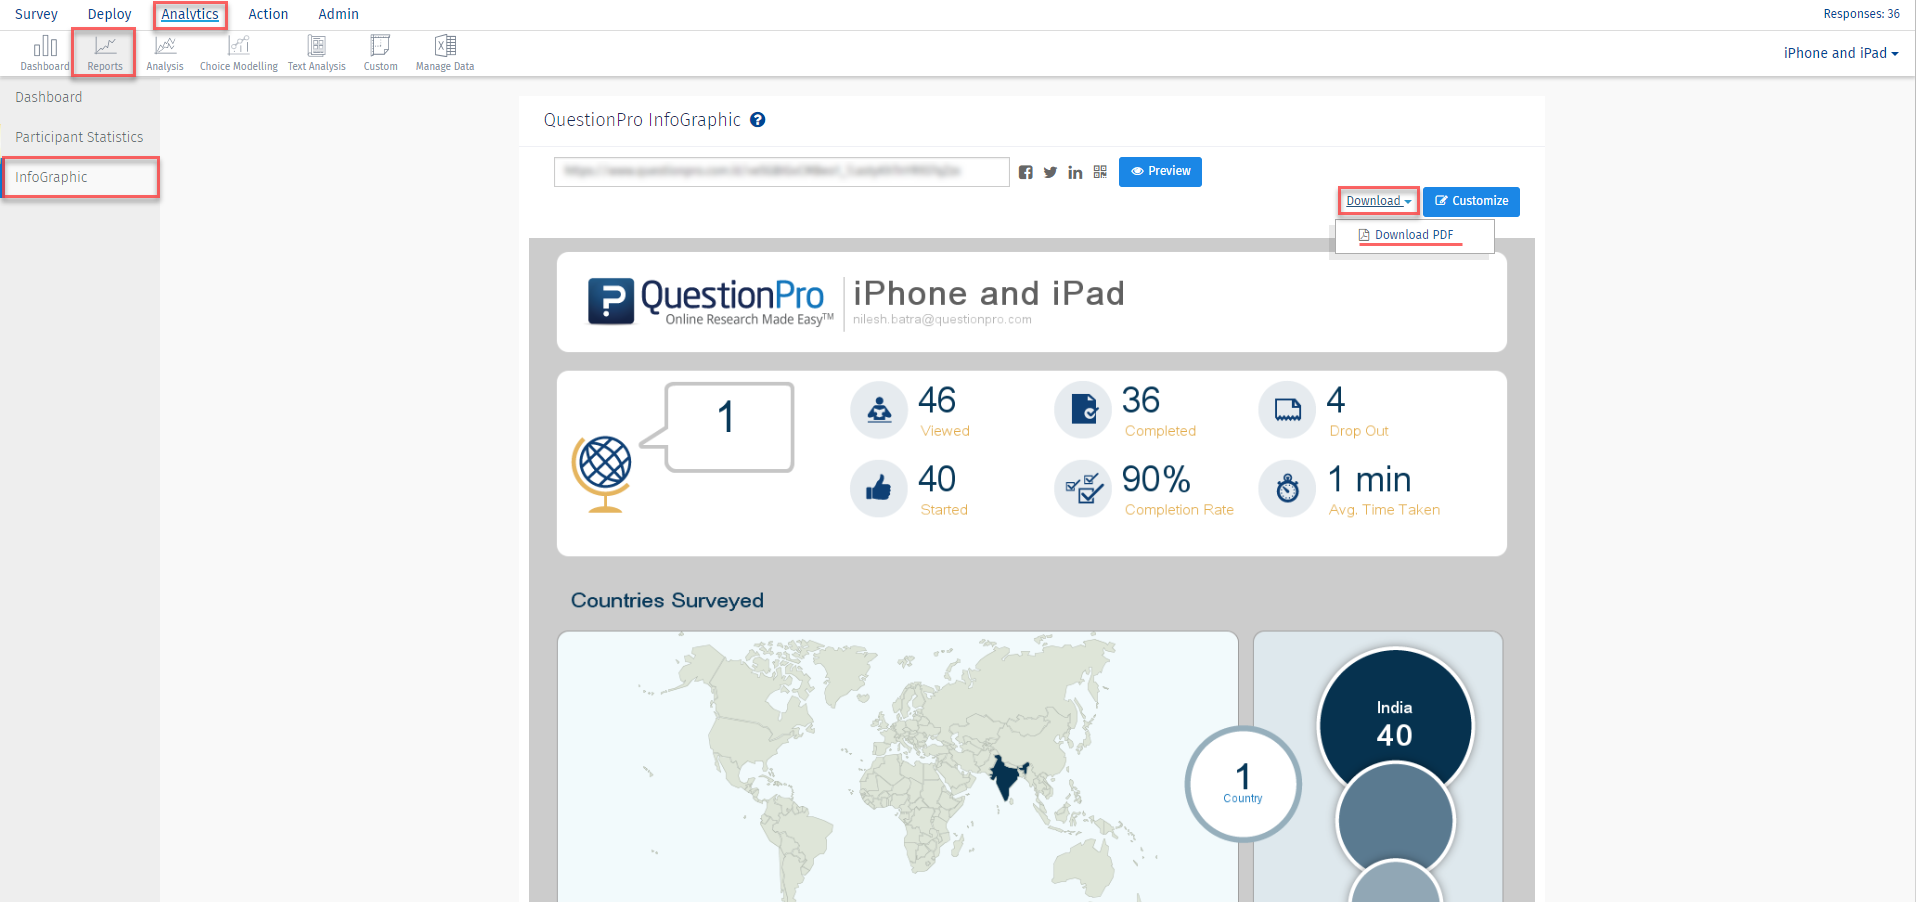
Yes, You can download the report.The download menu is in the top right corner right next to the customize button. The report will be downloaded in pdf format.

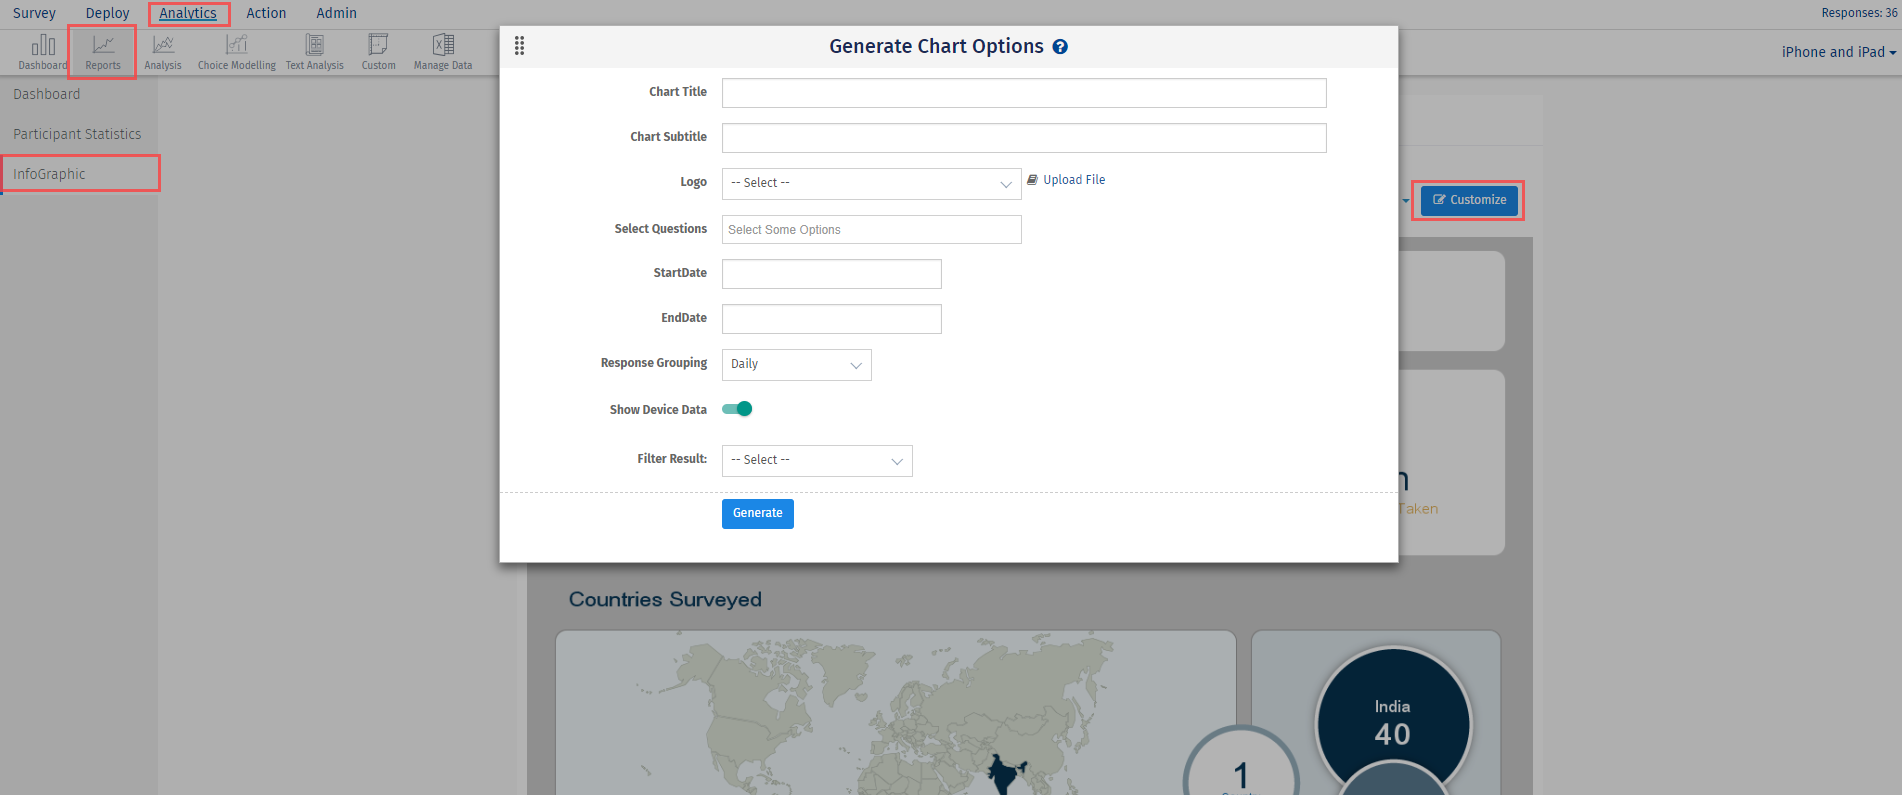
You can customize the Infographic Report. To customize your report just click the customize button on the top right corner. There are quite a few settings you can change here. Customizations offered:
- Chart Title
- Chart Subtitle
- Logo
- You can limit the number of questions instead of generating the report for all the questions
- Apply time filter to your report by setting the start date and end date
- Set the response grouping to either daily/ weekly or monthly
- If you have collected the data using QuestionPro mobile app. You can include the device data in the report.
- Filter the data for completes only

This feature/tools described here are available with the following license(s) :

