
- Dashboard
- General reports
- Closed loop
- Weighted mean widget
- Push metrics
- Share dashboard link
- Sentiment and root cause analysis
- NPS Benchmark
- Priority Matrix
- Heatmap Widget
- NPS
- Designing CX Dashboard
- Sentiment Analysis Details
- Share Dashboard
- Enable Dashboard on Portal
- Custom Metrics
- Survey Resting Period
- Custom Metrics - Grid Widget
- CX Dashboard Sorting
CX- Exporting the report to Word, Excel, or Powerpoint
After you have collected your data you can visualize the data on QuestionPro. However, a lot of times that is not enough when it comes to data analysis. You need to download the data in different formats and use some statistical tools to analyze it. QuestionPro offers data export in various formats like excel, powerpoint, spss, csv. On top of that you can also export cross tabulation and pivot tables that you generate online.
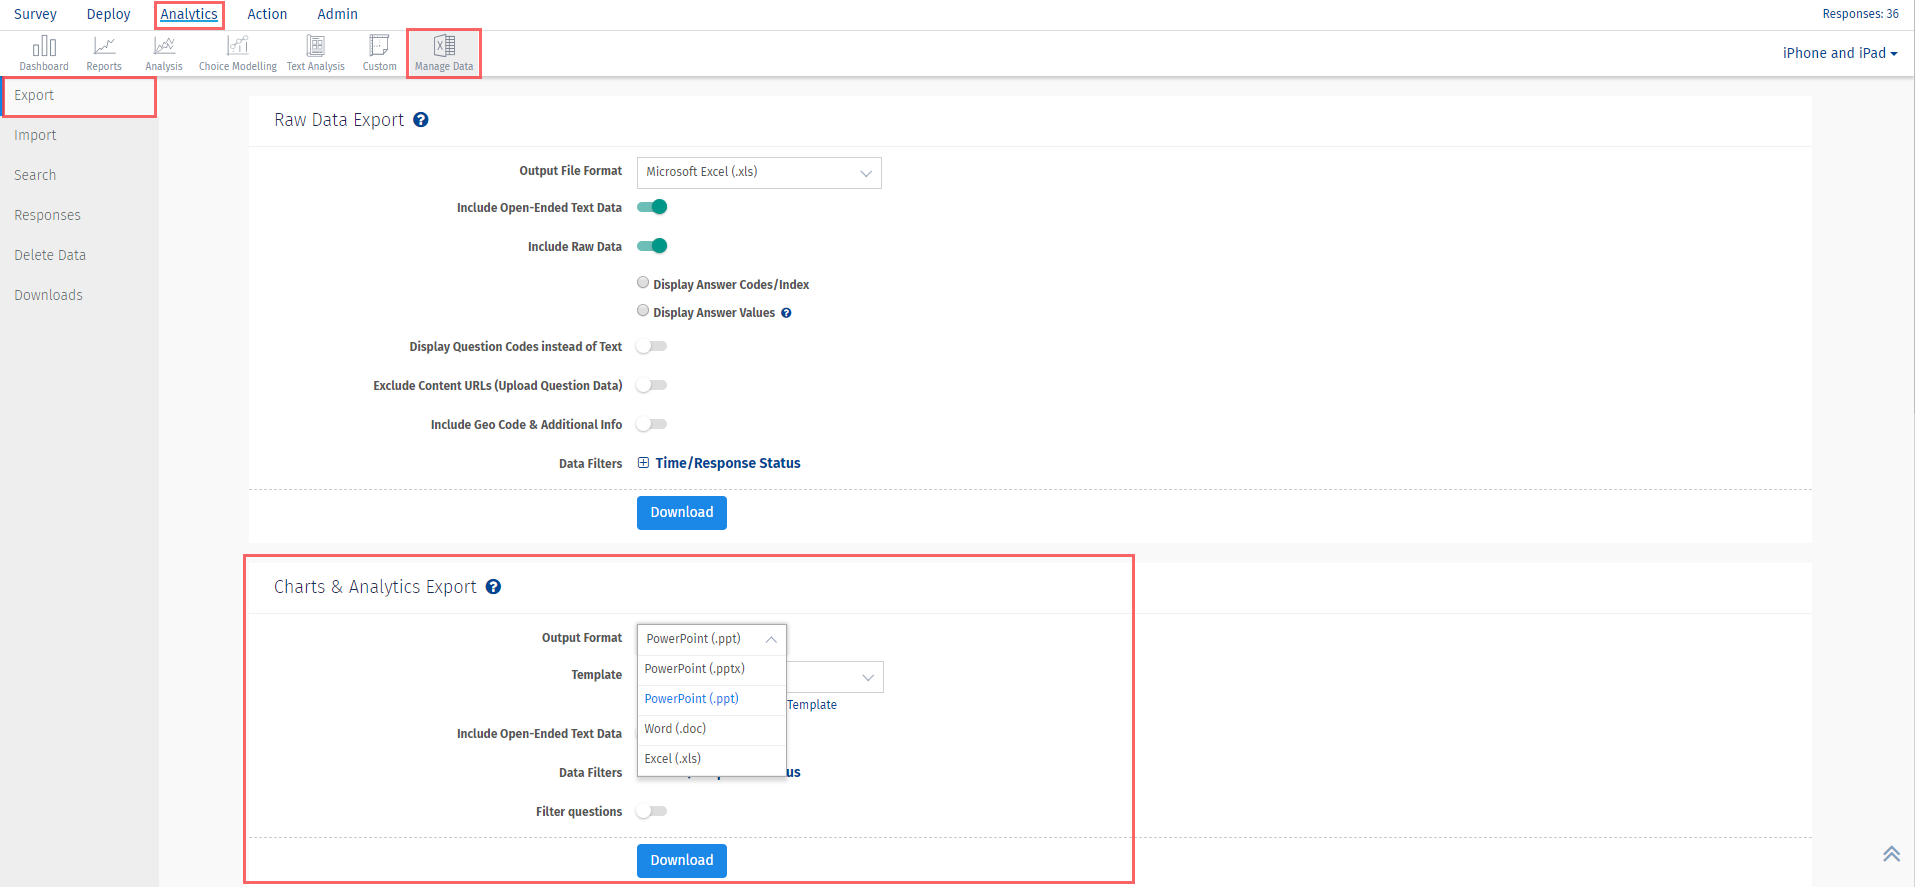
- Go To: Login >> Customer Experience >> Analytics >> Manage Data >> Export
- Under Charts & Analytics Export, select the suitable format.
- Following file formats are available:
- PowerPoint (.ppt)
- Word (.doc)
- Excel (.xls)
- PowerPoint (.pptx)
To generate a PowerPoint Report, go to:
- Go To: Login >> Customer Experience >> Analytics >> Manage Data >> Export
- Under Charts and Analytics Export, choose PowerPoint
- Choose the correct template.
- After choosing the template, you may click on View Template to see how will the PowerPoint look like.
- You may toggle the option for Include Open-Ended Text Data to on or off.
- Under Data Filters, you may set the data filter.
- Enable the option for Filter questions, if you wish to include only specific questions in the PowerPoint
- Click on Download
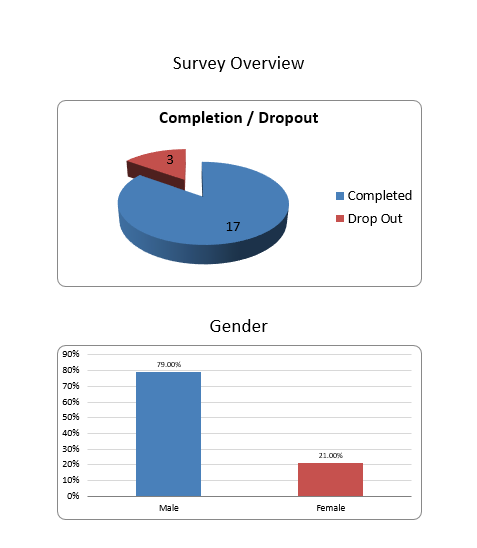
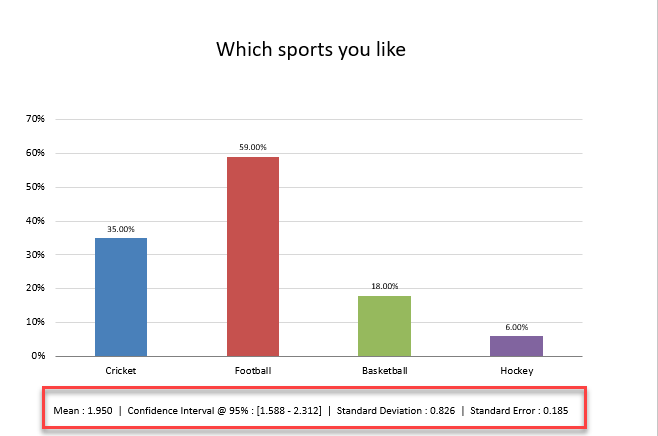
Yes, you can view the Survey Statistics in the PowerPoint report. Refer the screenshot below:
- Click on Add Custom Template
- Upload PowerPoint template with .potx format
- You can choose this custom template from the Template drop menu.
- Click on the Download button to generate the file.


Click on Delete Custom Templates
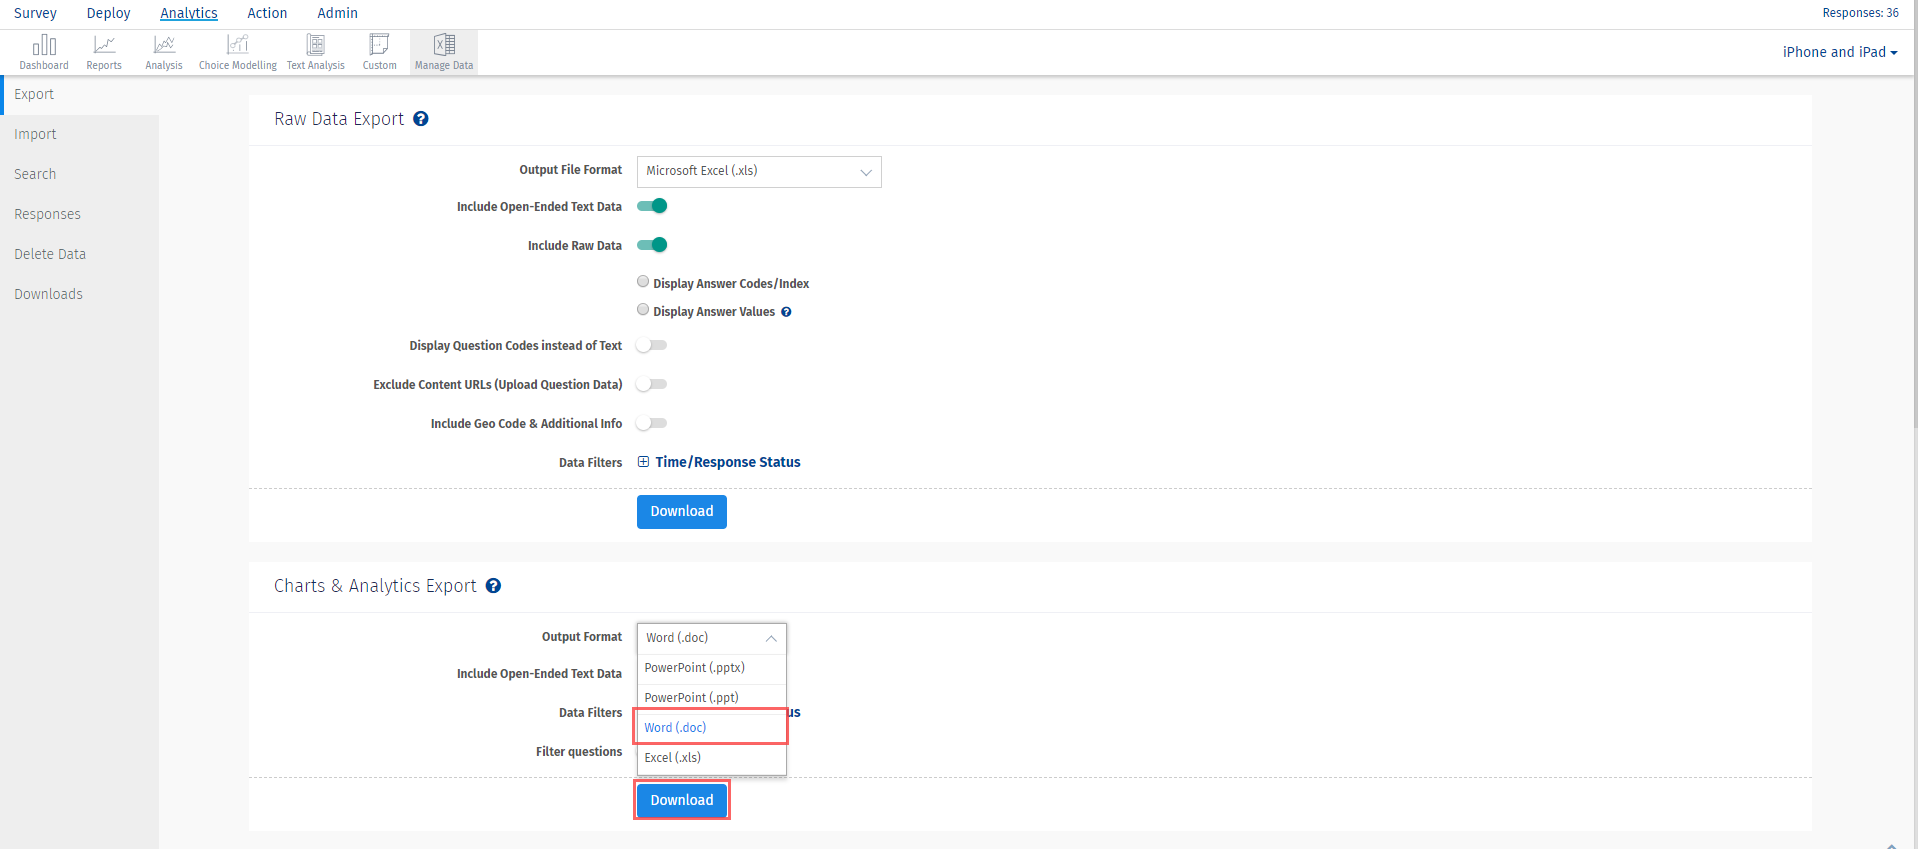
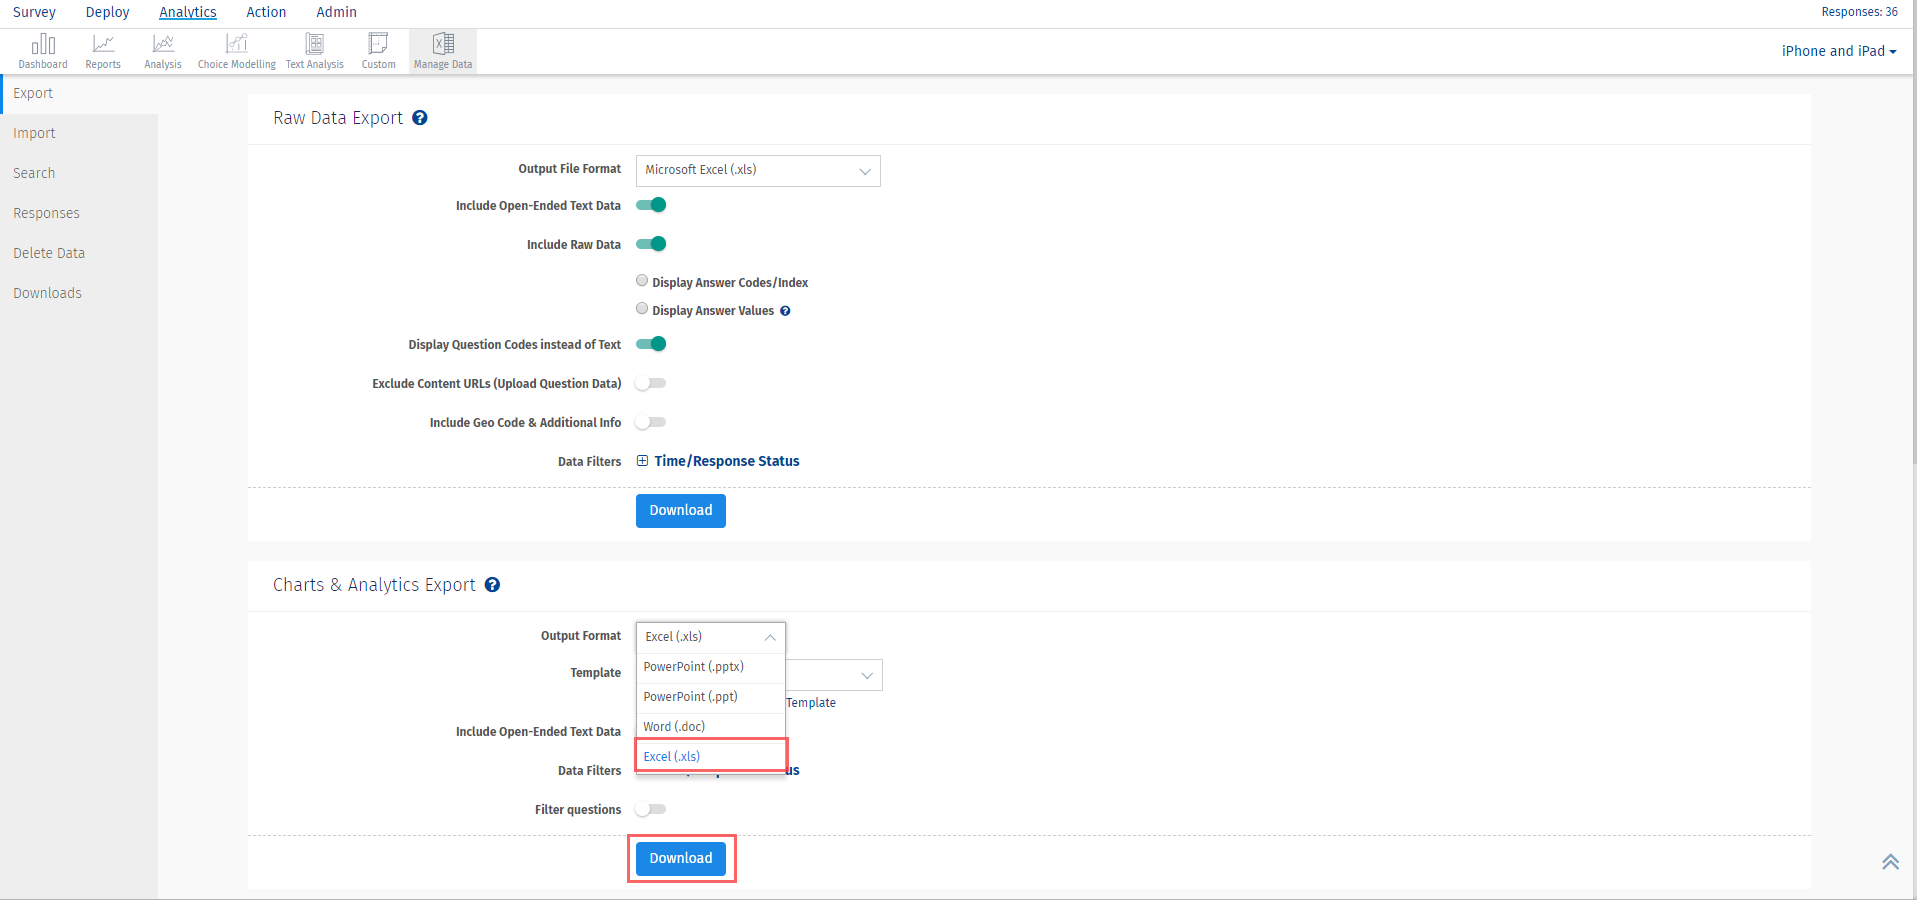
- From the Output Format drop menu select the Word (.doc) option.
- Turn on button for Include Open-Ended Text Data to include text responses.
- You can select from the Time or Response Status data filters.
- Click on the Download button to generate the file.
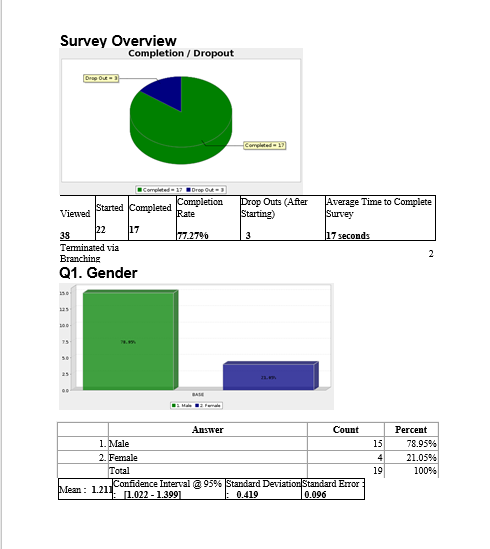
- From the Output Format drop menu select the Excel (.xls) option.
- Turn on button for Include Open-Ended Text Data to include text responses.
- You can select from the Time or Response Status data filters.
- Click on the Download button to generate the file.

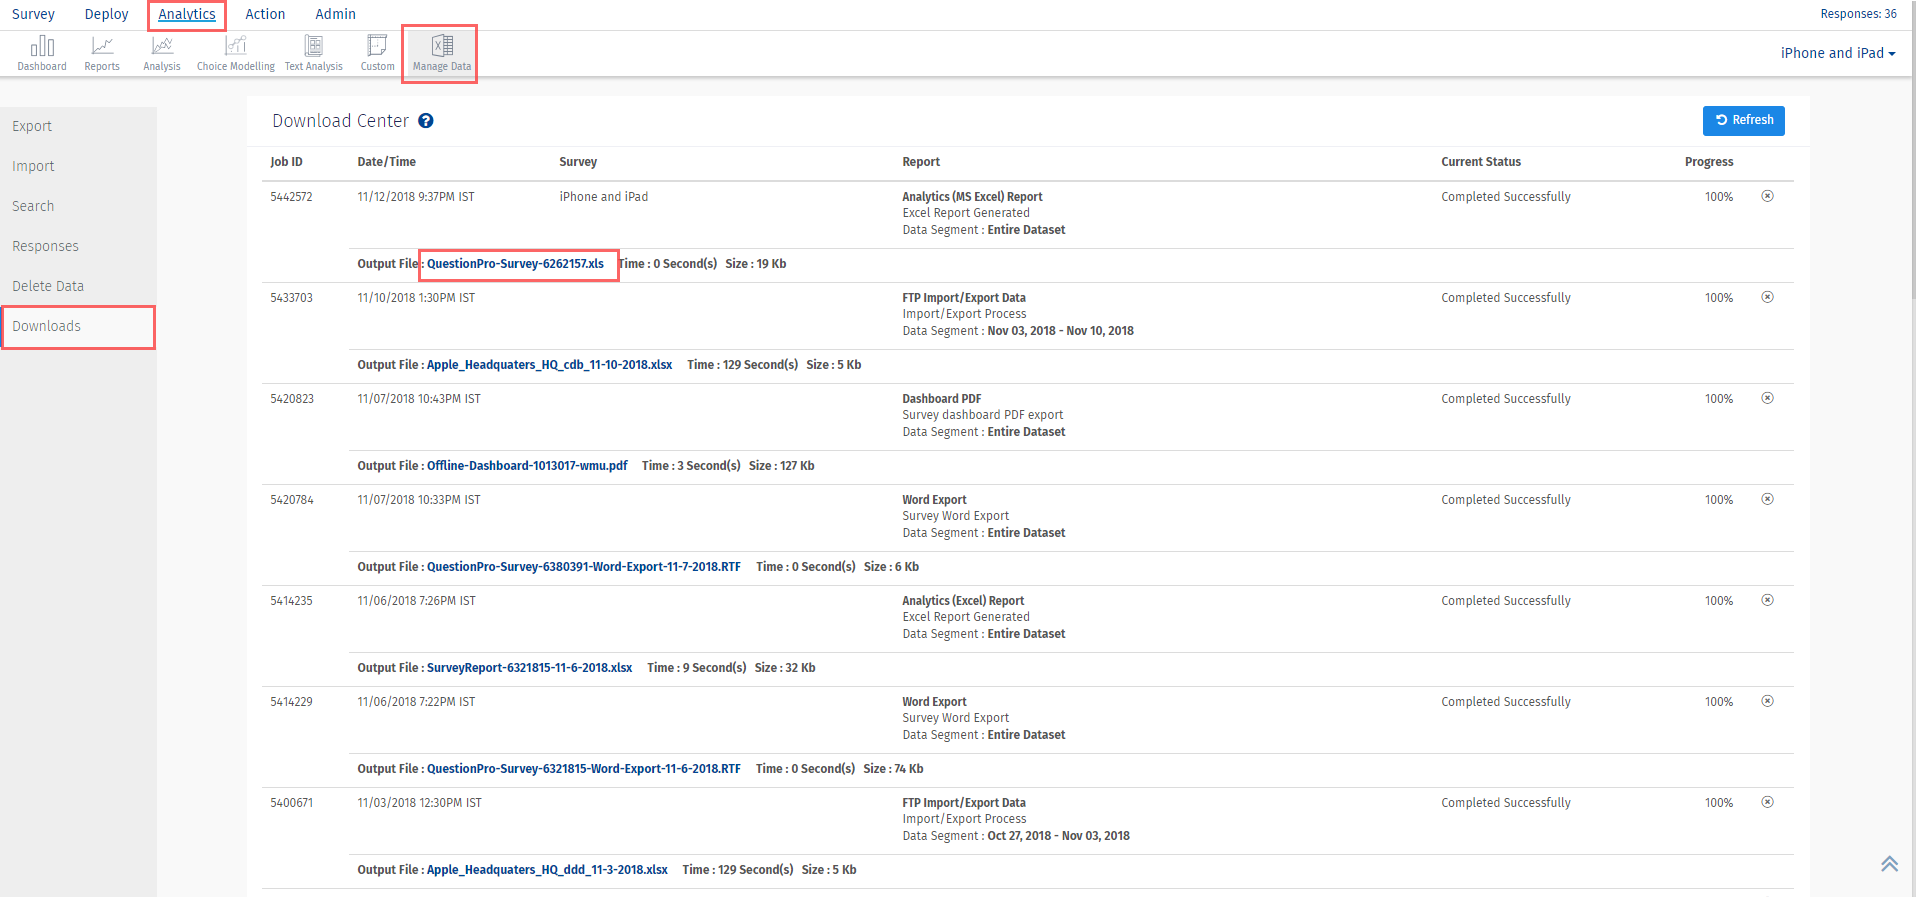
The report once generated is automatically emailed to the Account Email address. You can also access/download the generated report(s) from the Download section.
This feature/tools described here are available with the following license(s) :

