- Dashboard
- General reports
- Closed loop
- Weighted mean widget
- Push metrics
- Share dashboard link
- Sentiment and root cause analysis
- NPS Benchmark
- Priority Matrix
- Heatmap Widget
- NPS
- Designing CX Dashboard
- Sentiment Analysis Details
- Share Dashboard
- Enable Dashboard on Portal
- Custom Metrics
- Survey Resting Period
- Custom Metrics - Grid Widget
- CX Dashboard Sorting
CX - Create Trend Analysis
Trend analysis gives you the ability to take a look at data over time for a long-running survey. This can be useful for comparing quiz or test scores (see increase in knowledge over the course if you administer the same survey multiple times over the matter of a few weeks or months), or identifying trends for a satisfaction survey that is distributed regularly.
How can I set up a trend analysis?
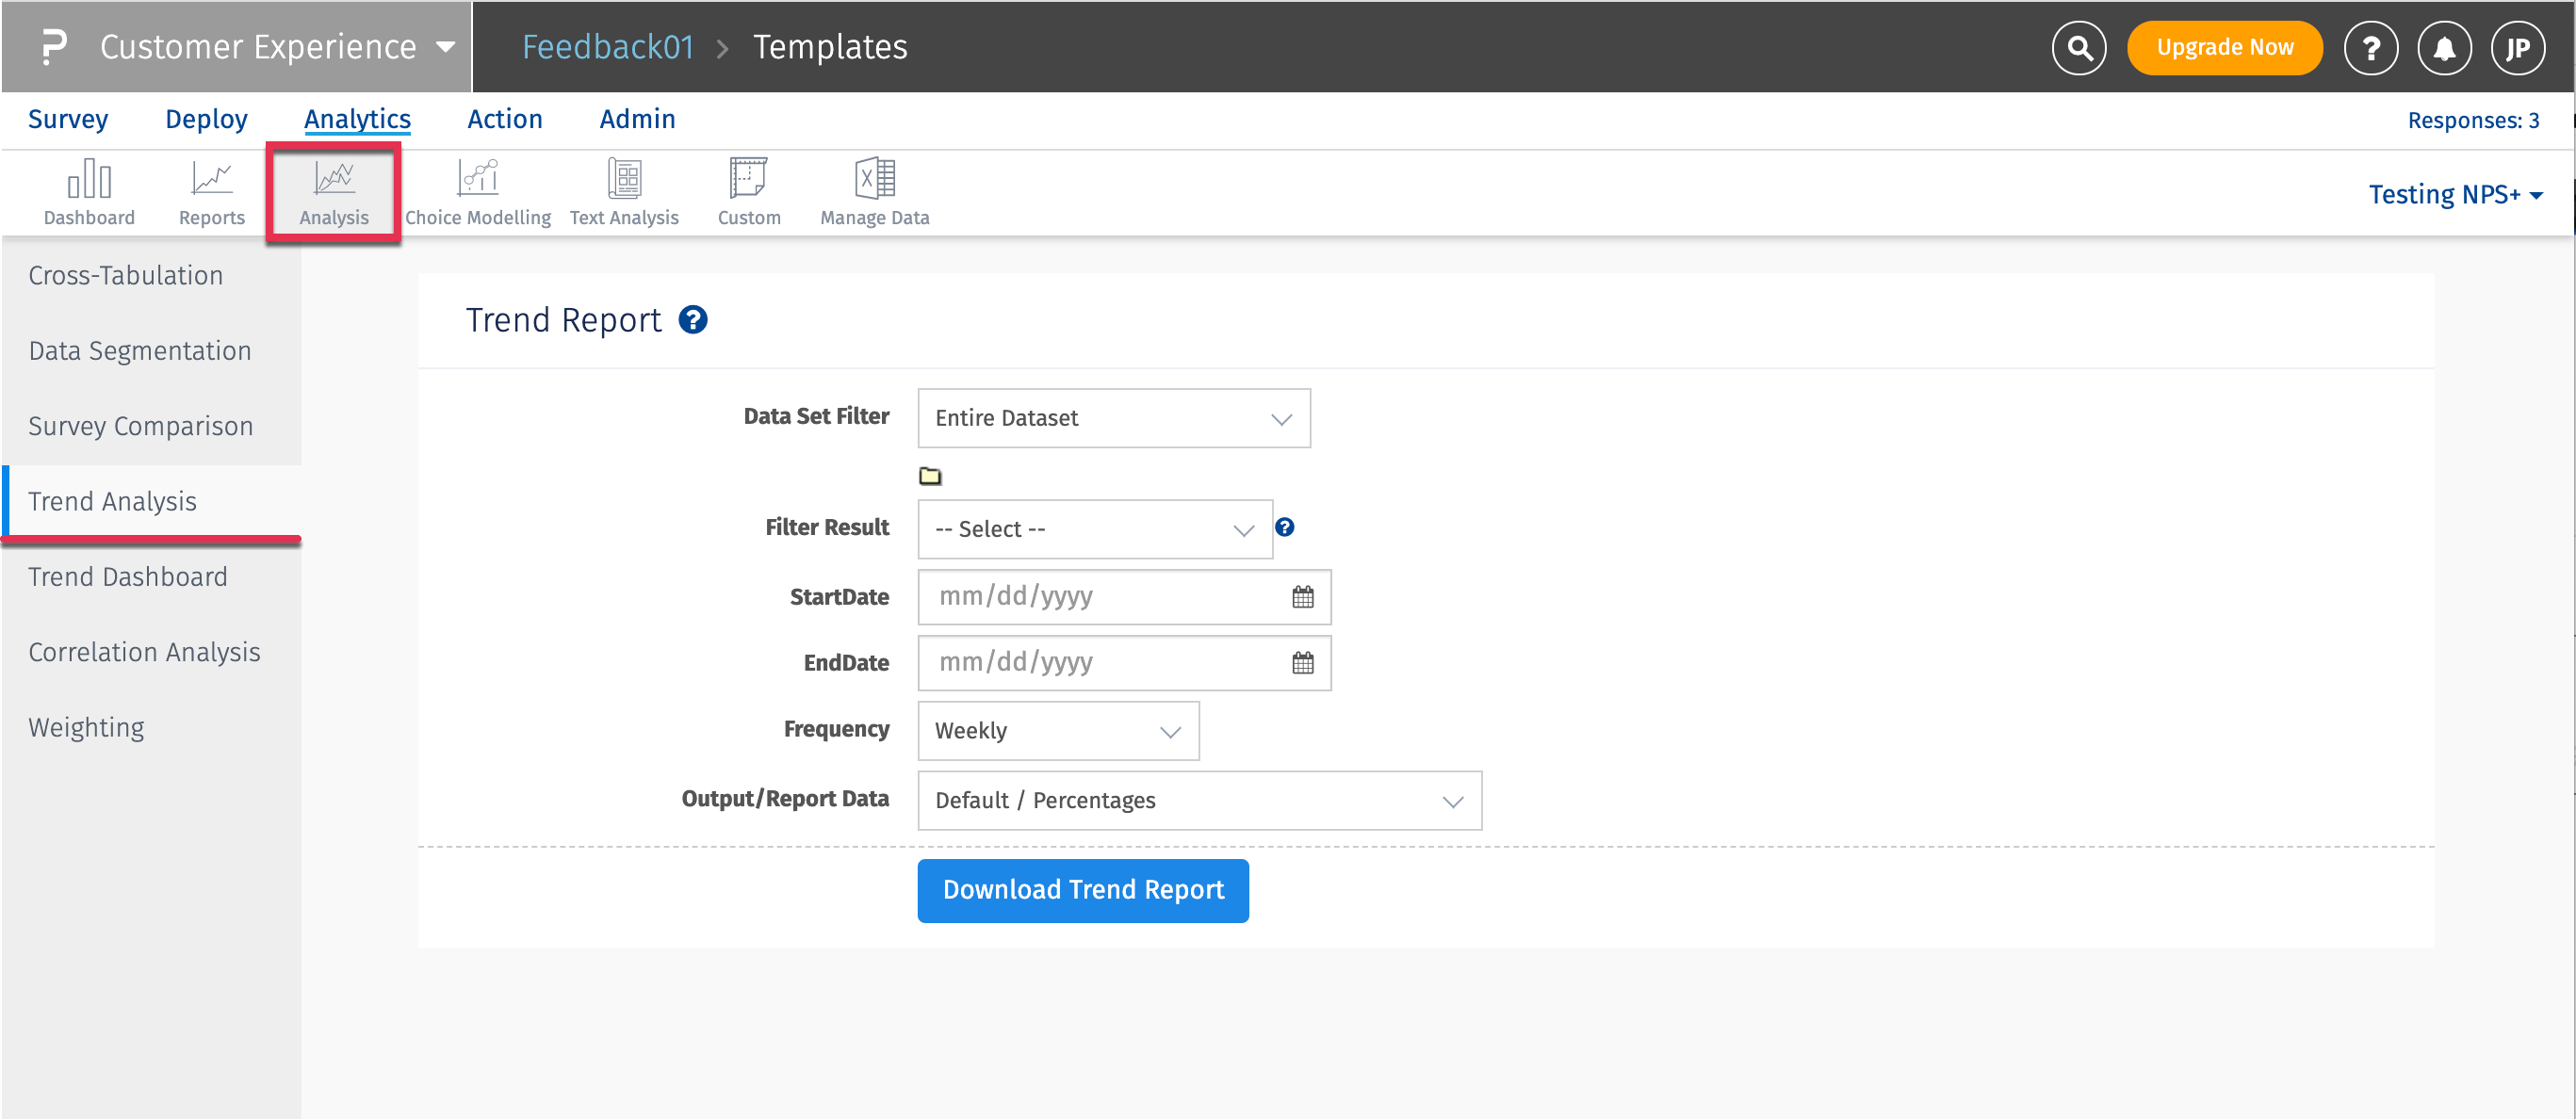
- Login » Customer Experience » Analytics » Analysis » Trend Analysis
- Select the Data Set Filter. If you have set up report data filters already, they will be available in this drop-down.
- Select the Filter Result, which is the type of filter to apply to the results (completed, started but not completed, terminated via branching).
- Completed: anyone who completed the entire survey is included in this set.
- Started but Not Completed: anyone who started but did not actually complete the survey is included in this set.
- Terminated via Branching: anyone who was terminated due to branching (where the option “Terminate Survey” was selected) is included in this set.
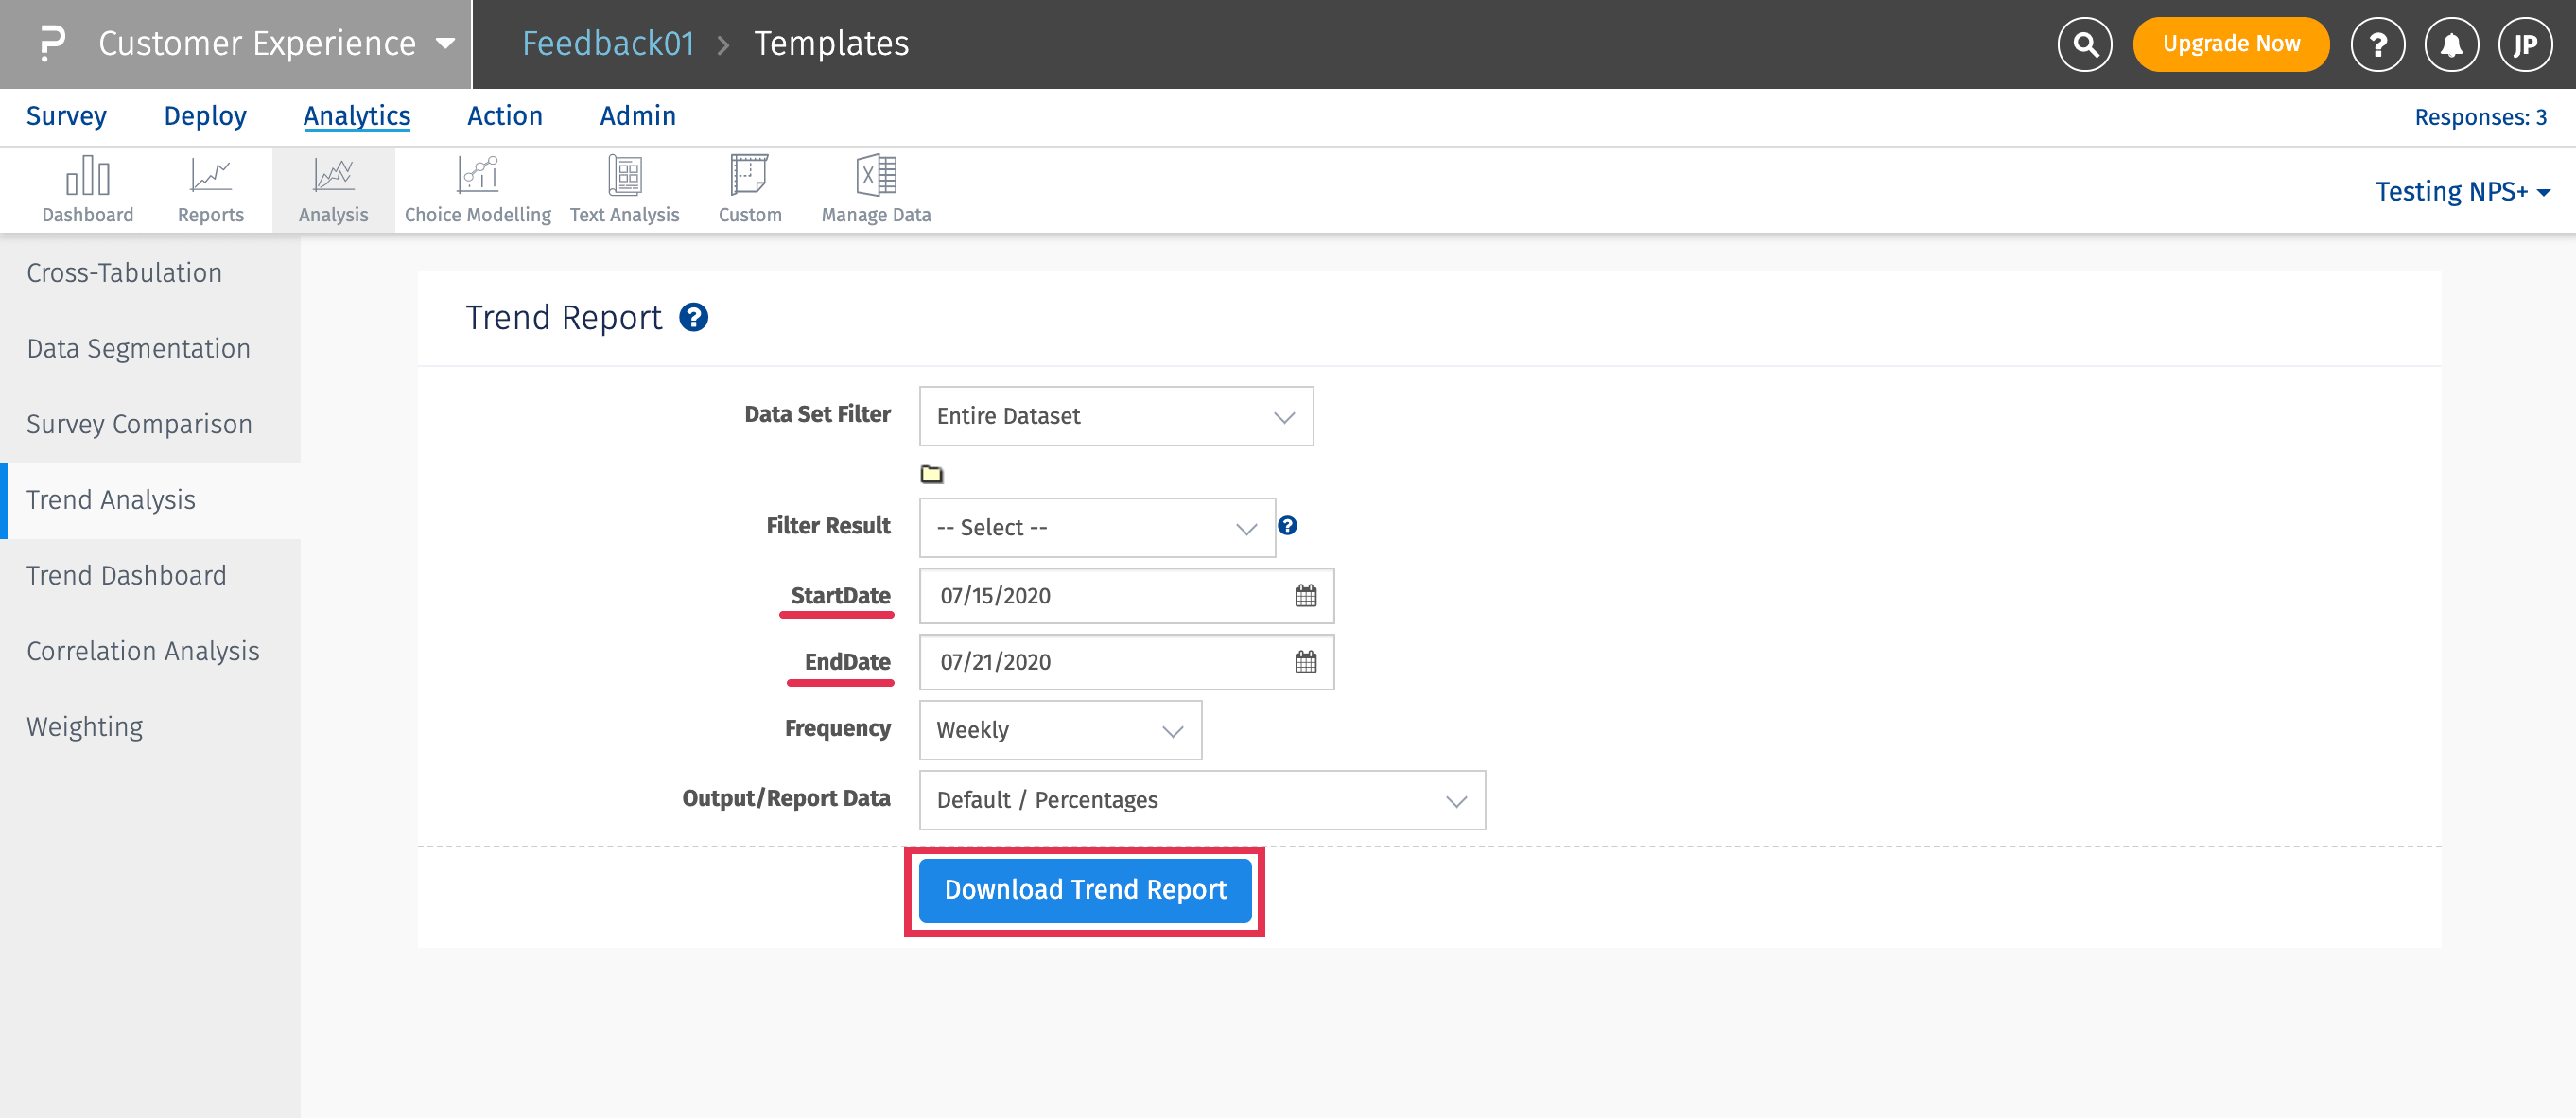
- Include the Start Date and End Date for the time span you want to trend.
- Select the Frequency you want the trend calculated (weekly, monthly, quarterly, or annual).
- Select the Output/Report Data type desired.
- Click Download Trend Report. A report will be generated and delivered to the email address associated with your account.


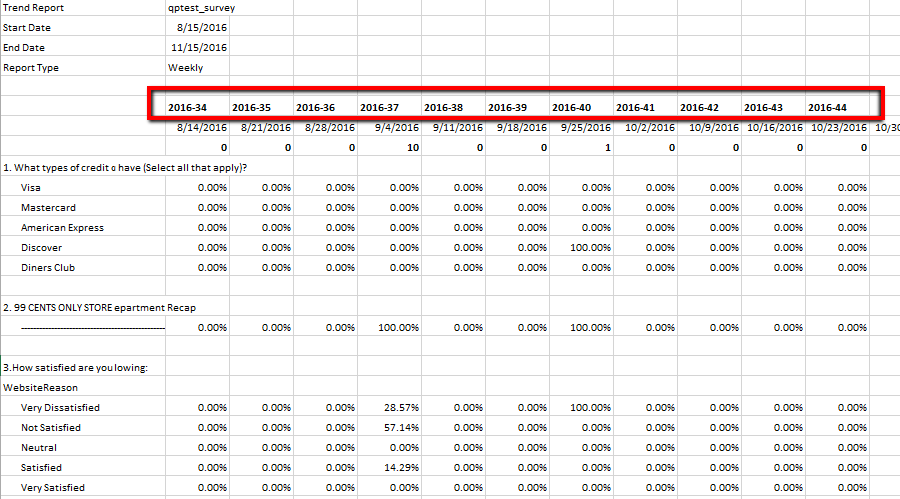
The report will look something like the image below, with each column showing the data over the time period requested as Frequency, for as many columns as it requires to fulfill the time period being reported.

License
This feature/tools described here are available with the following license(s) :
Customer Experience (Annual) and above- Buy Now - $75/Month
You may also be interested in...
Text Analysis | Categorization
GAP Analysis - How it works?
Consolidate Report | Combine Reports
Detailed Statistics for Trend Analysis - How to?

